Dashboard
Browse
Client mode / Dashboard
The dashboard module lets you visualize the network from several perspectives: network load, application health-check, DSCP consistency, etc. across the network or for a specific site. The management bar, at the top of the dashboard, helps you choose the site, application or device, filter on a period and update all dashlets according to the selected scope.
You can add new dashboards in your multi-tab environment by browsing the library or by drilling down a network element for more details (see Drill down for more details).
Access the dashboard module by clicking
 in the client main menu.
in the client main menu.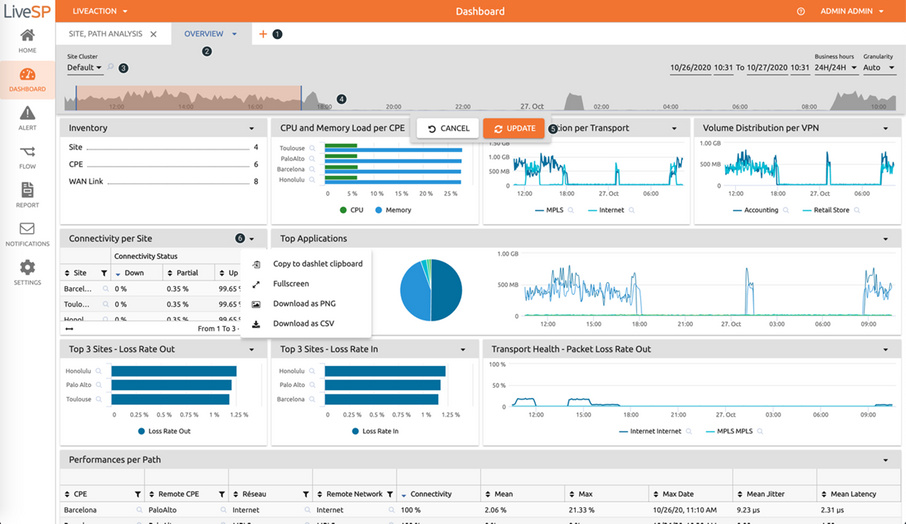
1. Open the library to display dashboards.
2. Include several dashboard tabs in your personal workspace; a lock indicates you cannot edit the dashboard (because you are not the author).
3. Filter and select network elements you want to visualize.
4. Select observation period and zoom in on timeline for more details; dashlets will be updated according to the network selectors and time period.
5. Update dashboard.
6. Use the arrow to expands more options on dashlets, such as export your table in CSV file format or your dashlet to a PNG file format.